| Aspect | Bullish Candlestick | Bearish Candlestick |
|---|---|---|
| Color | Typically green or white | Typically red or black |
| Open vs. Close | Close price > Open price | Close price > Open price |
| Market Sebtiment | Indicates buying pressure (bullish) | Indicates selling pressure (bearish) |
| Trend Signal | Signals upward momentum | Signals downward momentum |
✤ Definition:
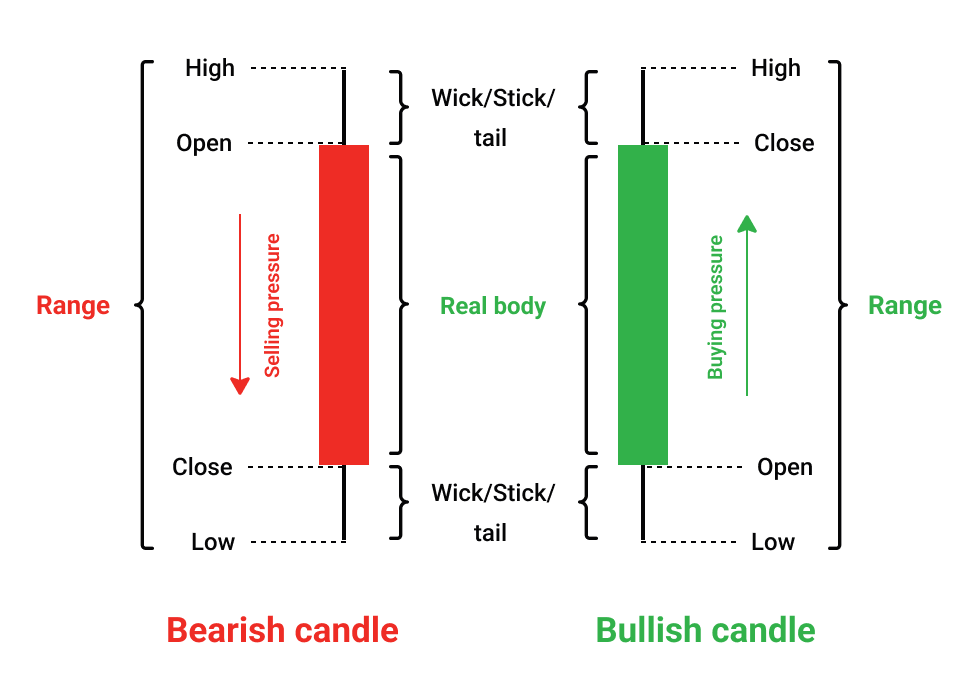
☛ A candlestick that indicates price appreciation or upward movement during the selected time frame. It reflects that the closing price is higher than the opening price.
✤ Appearance:
☛ The body of the candlestick is typically colored green or white (though colors can vary based on chart settings).
☛ Open price is at the bottom of the body.
☛ Close price is at the top of the body.
✤ Shadows (Wicks):
☛ Upper Shadow: Represents the highest price during the period.
☛ Lower Shadow: Represents the lowest price during the period.
✤ Interpretation:
☛ Indicates that buyers (bulls) are in control and are driving prices upward.
☛ Common in uptrends or as part of bullish reversal patterns after a downtrend.
✤ Definition
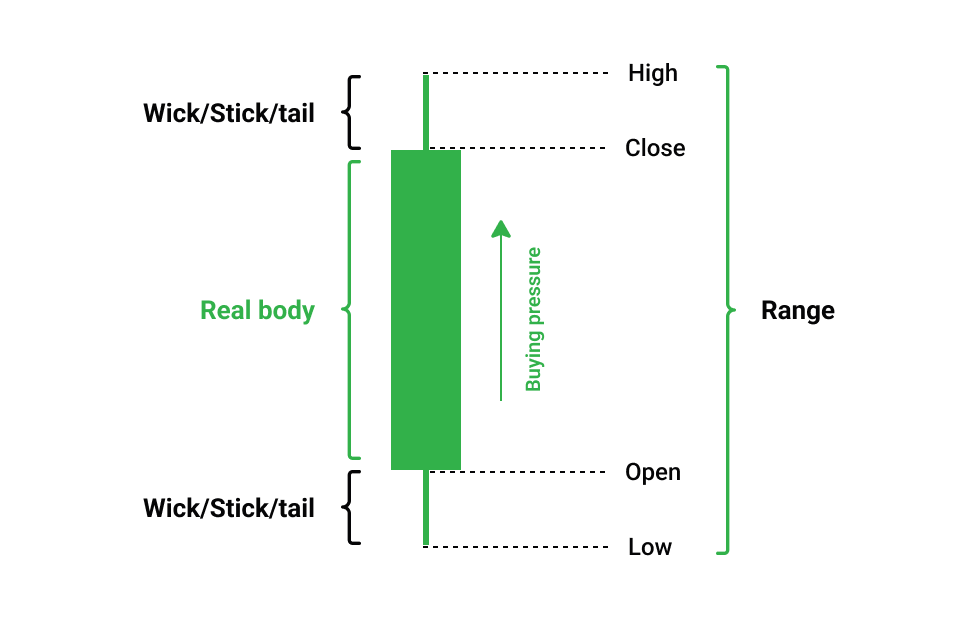
☛ A candlestick that indicates price depreciation or downward movement during the selected time frame. It reflects that the closing price is lower than the opening price.
✤ Appearance
☛ The body of the candlestick is typically colored red or black (though colors can vary based on chart settings).
☛ Open price is at the top of the body.
☛ Close price is at the bottom of the body.
✤ Shadows (Wicks)
☛ Upper Shadow: Represents the highest price during the period.
☛ Lower Shadow: Represents the lowest price during the period.
✤ Interpretation
☛ Indicates that sellers (bears) are in control and are pushing prices downward.
☛ Common in downtrends or as part of bearish reversal patterns after an uptrend.